In recent years, the world has witnessed how sudden and devastating earthquakes can be. With growing urban density, tools like Cesium are essential for real-time impact visualization. even moderate tremors can lead to significant human and economic losses. The challenge isn’t just detecting an earthquake—it’s quickly understanding its impact and visualizing where resources need to go first.
That’s the idea behind building a real-time earthquake impact visualizer using CesiumJS for 3D mapping and Python for seismic data processing and predictive modeling. This isn’t just another map—it’s a tool to help responders make faster, smarter decisions.
Why Real-Time Visualization with Cesium Matters
Every second counts in disaster response. Once an earthquake strikes, responders need to know:
- Where was the epicenter?
- Which areas felt the strongest shaking?
- How many people or buildings may be affected?
- Are hospitals, schools, or transport routes in danger?
Traditional reports are useful but can take time to interpret. A visual platform offers a faster way to grasp the situation—especially when time is critical.
What is Cesium JS?
CesiumJS is an open-source 3D geospatial visualization library that allows you to create interactive Earth models in a browser. It supports:
- 3D terrain and buildings
- Real-time data overlays
- Camera controls and timeline animations
- Integration with satellite data and weather APIs
Its speed and performance make it ideal for disaster simulation and monitoring use cases.
Data Processing and Modeling with Python and Cesium
While Cesium handles the frontend, Python works behind the scenes to:
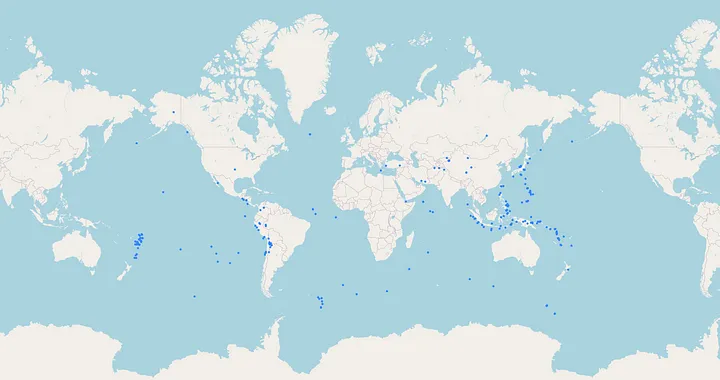
1. Fetch Real-Time Earthquake Data
Using APIs like USGS Earthquake Feed, we gather seismic data in real time.
2. Run Impact Simulations
We use simplified ShakeMap models to estimate the reach and intensity of the quake. These models consider:
- Magnitude
- Depth
- Distance from epicenter
- Local ground composition
3. Predict Affected Zones
Python scripts calculate likely areas of damage and population exposure based on GIS datasets and population density maps.
4. Push Data to Cesium in Real Time
Data is sent to the Cesium viewer using WebSocket or REST endpoints, so visuals update as new information arrives.
System Architecture Overview
- Frontend: CesiumJS, hosted on a lightweight web server
- Backend: Python with Flask, running on a cloud VM or local server
- Data Sources: USGS, OpenStreetMap, census data, historical earthquake databases
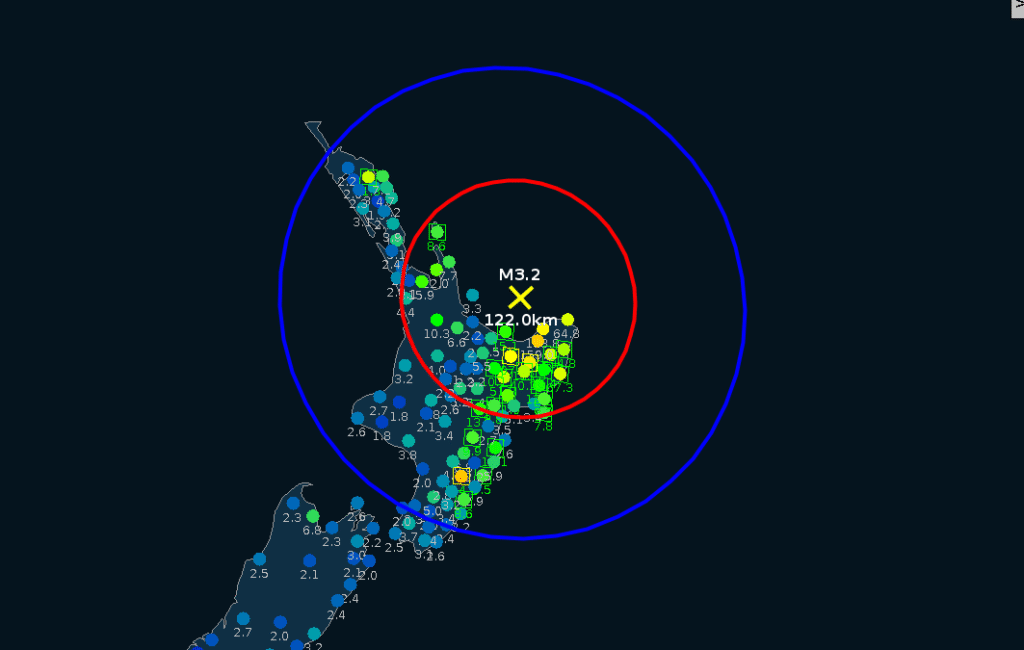
Visualization Layers:
- Epicenter as a pulsating point
- Concentric circles showing impact radius
- Heatmap of shaking intensity
- Infrastructure markers (hospitals, power stations, etc.)
When an event is detected, the system updates the map in seconds—giving first responders a powerful overview.
Real-Life Applications
This tool isn’t just for scientists. It has practical, real-world uses in:
- Emergency operations centers: Instantly understand where aid is needed most
- Smart cities: Trigger automated alerts or shutdowns (e.g., subways, pipelines)
- NGOs and relief organizations: Coordinate logistics for food, shelter, and medical aid
- News agencies: Visualize impact zones for live coverage
- Educational tools: Teach geology or emergency planning interactively
Challenges Faced
While building the platform, several technical challenges had to be tackled:
- Data latency: Real-time doesn’t always mean instant—some sources have 1–2 minute delays
- Terrain modeling: Elevation data had to be adjusted so shaking zones displayed accurately on 3D terrain
- Bandwidth optimization: Cesium renders in 3D, which can be heavy on devices with poor GPU or slow connections. We used simplified vector overlays as fallback
- Accuracy vs. speed: More complex models are slower to compute, so we had to strike a balance between precision and usability
What’s Next?
Here’s how the system can be improved in future iterations:
- Mobile alerts: Push SMS or app notifications for at-risk users
- Crowdsourced reporting: Allow users to report damage, which is then visualized live
- AI enhancements: Use machine learning to predict aftershock zones based on historical patterns
- Multilingual interface: Make the platform accessible to more regions by supporting local languages
Final Thoughts
By combining the power of geospatial visualization with real-time seismic data, we’re able to build more than just a map—we’re building a tool that helps save lives and allocate resources smarter.
Tools like this showcase how open-source tech + public data + thoughtful design can make a massive difference, especially when lives are on the line.
Whether you’re a developer, geographer, or emergency planner, this kind of system is worth exploring.
Because when the ground shakes, we should be ready—not reacting blindly.
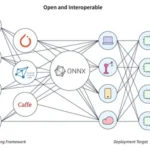
Read our more blogs- Developing an AI-Powered Code Portability Analyzer with Python and ONNX

Pingback: Flow & React: Decentralized NFT Art Platform