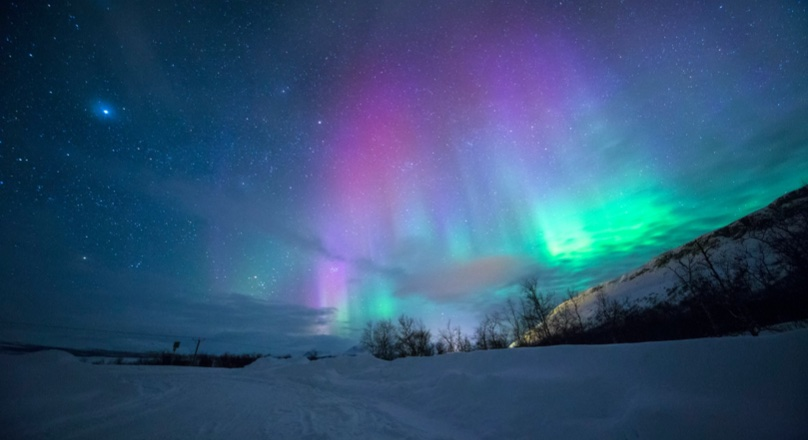
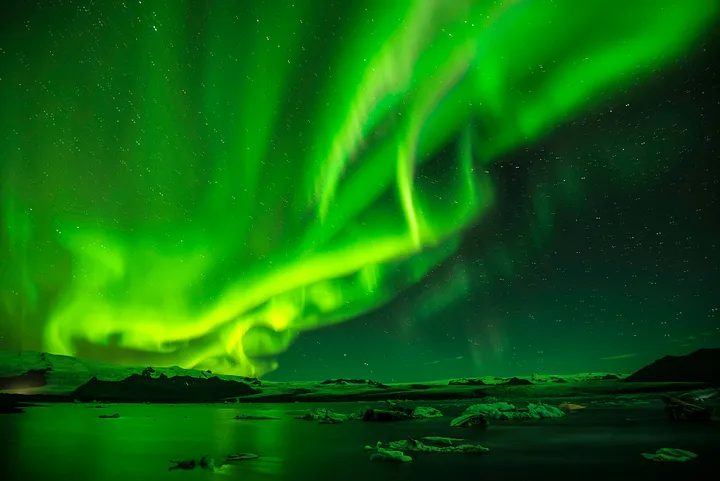
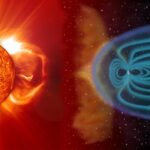
Honestly, I just love space stuff. The idea that we can see the effects of solar storms from Earth — how particles from the sun slam into our magnetic field and paint the sky? That’s wild.
And I wanted to build something alive, not just a static simulation. I wanted real-world data to drive it. So if the sun burps out some radiation today, my visualizer should go nuts.
Choosing the Right Tools
I knew I wanted this to live on the web. That meant it needed to be lightweight and browser-friendly. Naturally, I leaned toward Three.js — the Swiss Army knife for 3D graphics in web dev.
I’d used it once before for a spinning Earth demo — super janky, but fun.
The next big piece? Data.
Where the heck do you even get live aurora-related info?
Answer: NOAA.
They’ve got this amazing Space Weather Prediction Center, and they throw out loads of data — solar wind speed, geomagnetic indices, all that good geeky stuff. It’s public, it’s free, and it updates every five minutes. Jackpot.
Now, putting these together? That was where the chaos started.
Wrestling with the NOAA APIs
This part felt like decoding ancient alien scrolls.
NOAA’s APIs are… well, let’s say functional. You kinda have to squint at them sideways and dig through a few PDFs to really understand what each value means.
Eventually, I latched onto:
- KP Index: a 0–9 scale of geomagnetic activity — higher means stronger auroras
- Solar Wind Speed: gives a sense of how intense the solar stream is
It took a while (and by a while, I mean 2 hours and one nervous breakdown) to figure out how to fetch this data and parse it into something usable.
But when I finally got that first successful response and saw those little KP values pop into my console — man, that felt good.
Crafting the Aurora in 3D
Now came the fun (but brain-melting) part: building the visual.
I didn’t want realism. I wanted vibes.
Just enough to make someone feel like, “Oh hey, this is kinda what the aurora looks like if you squint and use your imagination.”
In Three.js, I experimented with:
- Particle systems
- Shaders
- Transparent geometries distorted with sine waves (which looked more like jellyfish at first)
Eventually, I settled on a wavy, semi-transparent curtain made of mesh that slowly shifted and changed colors — green, purple, sometimes reddish, based on the KP values from NOAA.
- When KP was low → it gently shimmered
- When KP spiked → it pulsed, stretched, and danced like it was alive
Bringing It to Life with Real-Time Data
This part was surprisingly chill.
Once I had the NOAA API working and the aurora visuals coded, all I had to do was set up a little polling function.
Every 5 minutes, the app:
- Hits the NOAA endpoint
- Grabs the latest KP index
- Adjusts the intensity and color of the aurora accordingly
Like a mood ring for the sky.
I even added a tiny live ticker:
“Solar wind: 600 km/s – Expect minor auroras”
“KP Index: 7 – Strong storm incoming!”
Was it accurate science? Ehhh. Close enough for a web visualizer.
But it felt real, and that was the point.
The Little Wins
Here’s the thing about these projects: they never go smoothly. And that’s okay.
- I accidentally broke the entire scene once by dividing by zero in a shader.
- I forgot to cap the KP index range — so when the API threw a weird value (like 9.33), my aurora stretched off into infinity. Not great.
But then… there were moments where it just worked.
Like, I deployed it late one night, and the KP spiked to 6 — and my little digital aurora flared up like crazy.
That made me sit back, sip my cold coffee, and grin like a maniac.
Could I Have Used Fancy Libraries or Tools?
Sure.
There are libraries to handle real-time data streams.
I could’ve used some heavy shader frameworks or offloaded rendering to WebGPU or something trendy.
But I didn’t want complexity.
I wanted ownership — to understand every single line and why it existed.
Sometimes, building slow and scrappy is just more satisfying.
What’s Next?
So now I’ve got this little real-time aurora thing living on my GitHub. I keep tweaking it.
- I added sound once — low ambient synths that respond to solar wind
- I’m probably going to add satellite tracking next, just ‘cause
- Thinking of making a mobile-friendly version too — maybe with touch interactions so you can “brush” the aurora like digital paint
But even if I never touch the code again, I’m glad I made it.
Because building something that responds to the literal sun — that’s just cool.
Takeaways, If You’re Still Reading This
- You don’t need to be an expert to build something beautiful. Just curious.
- Real-time data makes even the simplest visuals feel magical.
- NOAA is a goldmine for space data — not the prettiest, but super powerful.
- Three.js is your friend, even if it feels like your enemy at 2 AM.
- And finally: always document your API errors. Trust me.
Read our more content- Building a Decentralized Code Bounty Platform with Solana and Vue.js

Pingback: React & NASA Powered Real-Time Solar Flare Tracker