Rain Forecasting, Reinvented
Real-time monsoon prediction with Spark and Mapbox might sound intimidating, but combining stream processing and geospatial mapping makes it powerful. But if you’ve got even a slight itch for big data and geospatial visuals, this kind of project turns from complicated to exciting fast.
I’ve been exploring this space—basically hacking weather patterns using data pipelines, map tiles, and a lot of curiosity. Here’s how it works—and why it matters.
Why Rainfall Prediction Matters in 2025
In monsoon-heavy regions (think South Asia), timely rainfall prediction isn’t just a cool experiment—it’s survival tech. Agriculture, emergency response, city planning… everything depends on understanding and predicting rainfall with high accuracy.
But here’s the problem: legacy systems are slow. Most weather predictions are batch-processed and updated every few hours (if you’re lucky).
To address that gap, we turn to real-time stream processing and geospatial visualization.
Apache Spark: The Engine Behind Real-Time Magic
Let’s talk Spark. It’s not the flashiest name anymore, but it’s solid and fast—exactly what this project needs.
We used Spark Structured Streaming, which allows continuous ingestion of live weather data (from APIs, IoT sensors, etc.), crunches it in real time, and outputs useful insights.
Imagine this:
- Raw weather signals (temperature, humidity, pressure) stream in.
- Spark evaluates them every few seconds.
- Rainfall probabilities are calculated and published.
The best part? Spark handles this using the same familiar DataFrame transformations—only now it’s in motion.
Ingesting Data: The Rain Starts Here
The foundation is good data. If you feed the system junk, you’ll get junk out.
Sources include:
- Government weather stations (with slight delays)
- Live sensor feeds (IoT if available)
- Satellite overlays (optional, for higher-end setups)
Processing Logic: Predicting the Pour
Once data starts flowing, Spark kicks in to clean and process it. Even basic threshold-based logic can be surprisingly effective at high refresh rates.
Want to get fancy? Add probabilistic models or lightweight ML inference inside the Spark job.
One neat trick: use a sliding window, say 15 minutes, to track sudden changes in humidity or temperature. A rapid spike in humidity alone might hint at incoming rain.
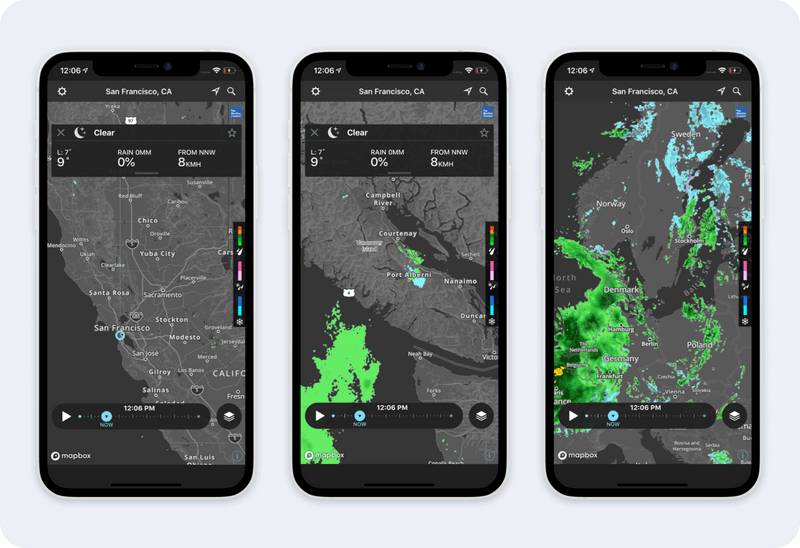
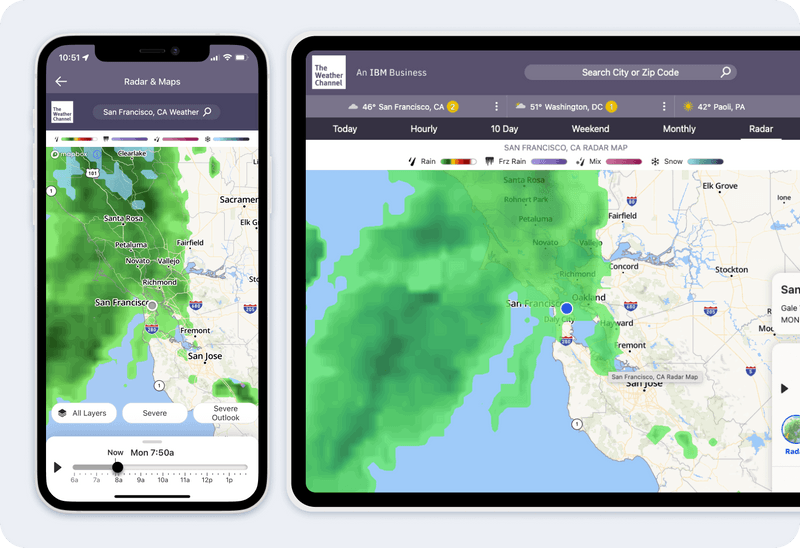
Mapbox: Visualizing the Monsoon Pulse
Data is powerful, but maps make it actionable.
Mapbox fits perfectly here—lightweight, customizable, and real-time friendly. We built a dashboard that overlays rainfall predictions on a regional map with:
- Color-coded rainfall intensity layers
- Live updates every few seconds
- Micro-alerts when rainfall probability crosses a set threshold
For example: If your district hits 70% rain probability, a red pulse appears. Simple, effective, and intuitive.
Challenges We Faced
Like all real-time systems, this one had quirks:
- Real-time breakage: Things randomly stop—Spark, APIs, or Mapbox tiles during overload.
- Geolocation mismatch: Some sources give lat-long, others give city names. Real-time geocoding is its own challenge.
- Chaotic weather: Patterns shift rapidly. Your logic must adapt using feedback and tuning.
Real-World Impact
We ran an early trial in a flood-prone city area during June.
The official forecast missed a sudden 45-minute downpour. Our system caught it.
That moment? It validated everything.
Imagine this:
- Local officials get a blink alert 10 minutes before roads flood.
- Farmers see real-time rain heatmaps before sowing.
This isn’t about perfect forecasts. It’s about actionable signals.
Conclusion
This project wasn’t just tech for tech’s sake. It was about transforming fast data into fast decisions.
Apache Spark gave us the real-time processing power. Mapbox brought it to life visually. We didn’t need huge infrastructure—just a plan, some patience, and the right tools.
If you’re into weather, data, or geospatial storytelling—try this.
There’s a quiet thrill in seeing a storm show up on your screen… seconds before it hits the ground.
No flashy outro. Just this:
Build something that helps people stay dry.
Read our more blogs –Building a Decentralized Peer-to-Peer Energy Trading Platform with Polkadot and Svelte