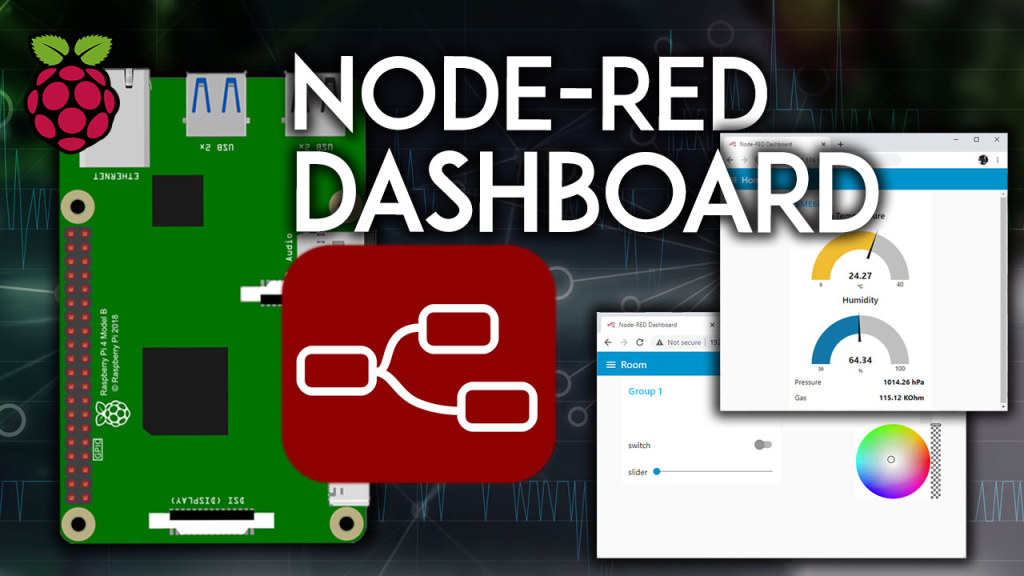
I thought IoT dashboards were for pros only. Big companies, slick hardware—definitely not me tinkering in my living room with a trial-and-error spirit. But one sleepless Thursday in 2024, after my third botched sensor deployment, I realized: I actually needed to see my data live. A dashboard would be a game-changer.
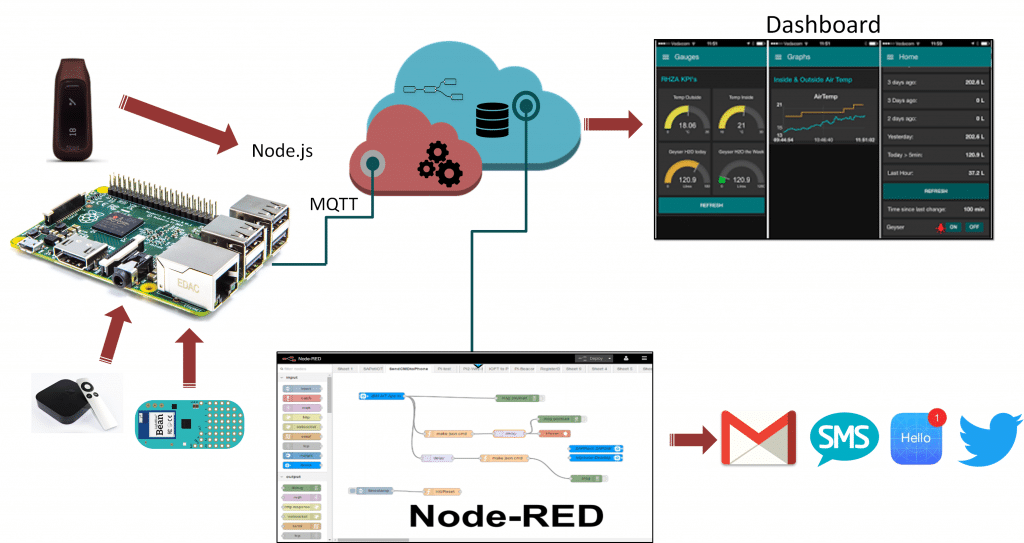
Enter Node-RED and MQTT—two tools that felt messy at first but eventually became my lifelines. Here’s how it really went down.
The IoT MQTT Setup That Broke My Brain

I had a handful of sensors sending temperature, humidity, and motion data via MQTT. Smart move, right? Except, I ended up with a free-floating data stream hitting a dark hole named “MQTT broker.” I couldn’t see a thing. All I wanted was a web dashboard reflecting real-time sensor changes.
My nightmare phase included:
- Random libraries that refused to connect.
- Dashboards updating at random intervals.
- UI elements that looked atrocious and broke mid-demo.
That was the “humble pie” phase: realizing a dashboard isn’t about pretty widgets—it’s about real-time visuals that work when you wave at a motion sensor.
Why Node-RED Was the Rescue
Node-RED felt like magic in disguise. It’s visually simple and can connect to MQTT with a couple of drag-and-drops, but sounded too good to be true. Guess what? It worked.
My first version was sloppy: live data streamed straight into some default chart plugin, dashboard looked clunky—buttons everywhere. It bubbled with pride, honestly. Then I overhauled it into something presentable-ish, added:
- Basic labels like “Kitchen Temp”
- Real-time updating charts
- Light color changes for motion alerts
It wasn’t beautiful. It was personal. And for my first demo—on a shaky Zoom call—it worked perfectly. No buffer. No delay. That “aha” moment made all the junky retries worth it.
Real-World Frustrations in IoT
I’ll keep it real: this wasn’t a smooth ride. I had at least five moments where I questioned my life choices:
- Dashboard nodes crashed randomly if MQTT messages spiked.
- Flow breaks where Node-RED froze because I paused the broker without noticing.
- Mismatch of units—Celsius vs Fahrenheit—made me look dumb to testers.
One night, I sat in bed thinking, “Is this really worth it?” But then I remembered showing my mom the dashboard—seeing her eyes light up at real-time kitchen humidity? Yeah, worth it.
Little Insights That Fixed Big IoT Problems
Here are some rough-and-ready lessons I wish I’d known:
- Always verify MQTT payloads. Even small sensors send “null” sometimes.
- Node-RED restarts: Use built-in restart strategies, or flows break. Save frequently.
- Limit chart history. If you leave graphs storing hours of data, it gets sluggish. Rotate data every minute.
- MQTT topics matter. Use clear naming—like
home/kitchen/temp—so you don’t get lost. - Watch your dashboard ports. By default, everyone could view it. Add an auth layer or hide it on LAN only.
A Real Example: Monitoring My Home Garden
Here’s a real scenario:
I set up moisture sensors and a small pump in my balcony garden. I used MQTT to publish readings every minute. In Node-RED, I grabbed that data, passed it to:
- A chart
- A node checking moisture thresholds
- A color-coded status (green = moist, red = dry)
When it dropped below 30%, Node-RED flashed a red banner on the dashboard—no auto-watering (I still want manual control). The real-time feedback told me, “Hey, water me.” No guesswork, no app alerts.
That’s when I knew I was onto something simple yet powerful.
Dashboard Design: Keep It Human
A dashboard isn’t a control panel for engineers—it’s a tool for anyone to understand at a glance.
So I went with:
- Big numerical reads
- Clear color states (like green, yellow, red)
- Minimal controls—just refresh or pause streaming
- Mobile-friendly layout
No bells and whistles. Just live sensor values, with visual cues—like a little leaf icon turning yellow = low moisture. People like that. My beginner friends got it instantly.
The Personal Touch (It Matters)
Honestly? My dashboard is nowhere near polished. I have overlapping text, layout quirks, and sometimes the chart doesn’t refresh until you click “Refresh”. But every imperfection came from a real scenario:
- I was debugging at midnight with one eye open.
- I barely cared if the UI looked good—so long as it worked when motion was detected.
- Even with flaws, it did its job: inform, not confuse.
In my mind, this is “hand-built IoT.” And that matters more than perfection.
The 2025 Edge: What’s Next?
Fast-forward to 2025—and things feel different already. Here’s what I’m exploring now:
- Edge-side Node-RED on Raspberry Pi: Visual logic and minimal latency, even when offline.
- Encrypted MQTT: TLS on port 8883, TLS certs issued via Let’s Encrypt.
- User-specific dashboards: A login layer—so only me (and maybe my mom) can view it.
- Analytics plugins: CPU usage, data trends over days—not just live numbers.
All simple steps that don’t require writing endless code, but improve resilience and trust.
Final Thoughts
If you’re reading this with sensors scattered around your desk, or thinking “this is too messy, maybe I should wait”—nah, jump in. Node-RED and MQTT won’t magically solve everything. You’ll hit bugs. Paths will break. You’ll publish null numbers and cringe.
But you’ll also get something magical: a live connection to your environment. You’ll see data, not just log it. You’ll realize “this actually works.” That’s the spark.
Build your flows. Add some frustration. Celebrate when your mom sees it working. Keep it real, keep it messy, and just start.
Read our more blogs-Stopped API Abuse with Express & Redis Limits


