When Monitoring Become Micro-Nightmares
Monitoring microservices sounded amazing when we first heard the pitch—modular, scalable, elegant. Monitoring in reality, however, turned out to be a maze of distributed debugging and invisible failures.
Monitoring microservices quickly became less about performance and more about playing detective when things inevitably broke.
One day, your user-service goes rogue. The next, the email-service starts sending newsletters to people who unsubscribed in 2019. Meanwhile, you’re digging through 17 different pods, piecing together logs and whispering:
“Was it me? Was it DNS? Was it fate?”
That’s when I realized: logs aren’t enough. We needed observability—real metrics, real insights, in real time.
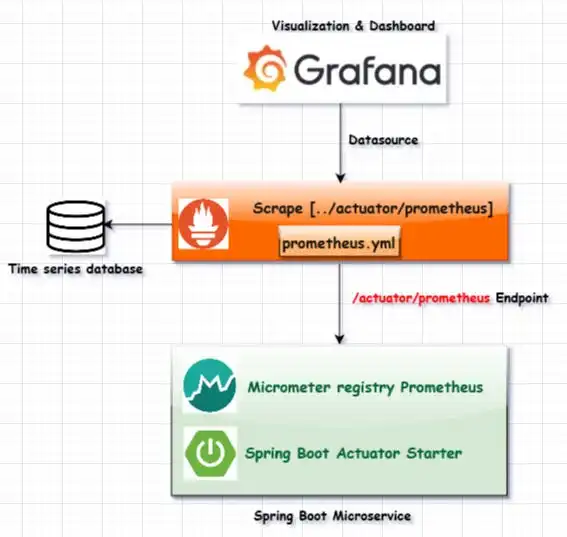
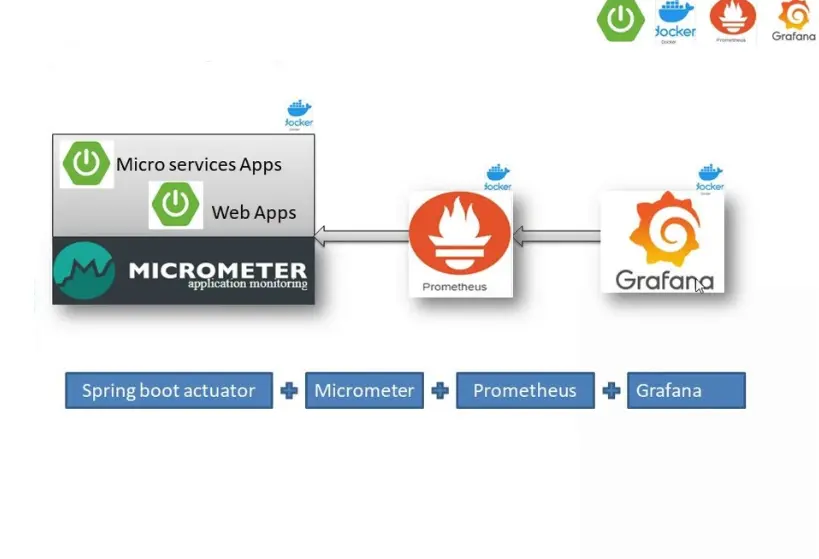
Why Prometheus? Why Grafana? for Monitoring Microservices
Prometheus was built in 2012 at SoundCloud to solve one problem: distributed monitoring that doesn’t suck.
Grafana joined the party as the dashboarding tool that made metrics beautiful—and actually usable in presentations.
Together, they became the peanut butter and jelly of modern monitoring stacks.
Benefits of Prometheus + Grafana
With this setup, you’re not just monitoring—you’re building a live pulse of your entire system.
- Real-time visibility into service health
- Custom dashboards tailored to teams or microservices
- Alerting that beats the boss to the bad news
- Open source, well-documented, and widely adopted
- A giant community that’s already solved your problems
Best Practices for Monitoring Microservices (a.k.a. What I Wish I Knew Sooner)
1. Avoid High-Cardinality Labels
Don’t tag metrics with unique IDs (like user IDs or timestamps). You’ll crush Prometheus—and your soul.
2. Group Your Alerts
You don’t need 37 notifications for one failing service. Use alert grouping to avoid pager fatigue.
3. Version-Control Your Dashboards
So when “someone” breaks the graphs, you can actually figure out who.
4. Don’t Monitor Everything
Be selective. Do you really need real-time RAM stats for the coffee machine service?
5. Set Sensible Alert Thresholds
A latency threshold at 1ms? Unless you’re Google, that’s a recipe for chaos every Tuesday.
Downsides (Yes, They Exist)
Prometheus and Grafana are awesome—but they’re not perfect.
- PromQL is… quirky. You’ll search “Prometheus query to get avg CPU” more times than you’d like to admit.
- Short-term storage: Prometheus alone doesn’t store metrics forever. Use Thanos or Cortex for long-term storage.
- Grafana dashboard sprawl: Everyone wants their own version. Document early.
Future-Proofing Your Monitoring of Microservices
Once you’re comfy with the basics, level up with:
- Alertmanager – Powerful routing, grouping, and escalation for your alerts
- Loki – Logs + metrics, finally together
- Kubernetes Service Discovery – Auto-magically track new services without updating config files
Observability isn’t a checkbox—it’s a living, evolving system of insight and trust.
Recap: Why Monitoring Microservices Matters
You’re building microservices. You’re scaling fast. And if you’re not monitoring your system right now, you’re setting yourself up for a spectacular, slow-motion crash.
Prometheus and Grafana give you clarity. Stability. Control.
And when something breaks at 3:00 AM (because it will), you won’t be guessing. You’ll be solv
Conclusion: From Panic to Peace of Mind
Monitoring microservices is not optional—it’s survival.
With the right tools and a thoughtful approach, you go from firefighting to foresight.
Prometheus and Grafana aren’t just open-source tools—they’re sanity-saving essentials.
And once you see what your systems are actually doing, you’ll wonder how you ever worked without them.
Because when your services fail, metrics shouldn’t.
Visit here to read more post:- Aligning student skills with employer expectations